
How to generate reports
-1.png?width=654&height=315&name=SC%20-%20Registro%20de%20eventos%20(12)-1.png)
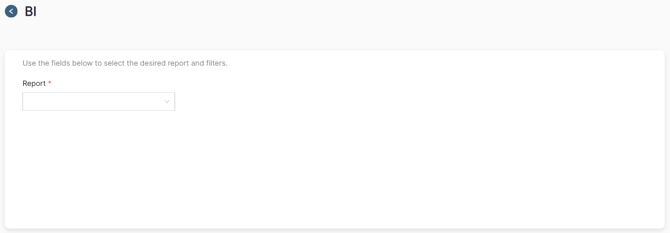
1. In the sidebar menu, hover over the Insights module and click on BI.
2. Choose the type of report you want, add the basic and/or advanced filters, and click on apply filters.
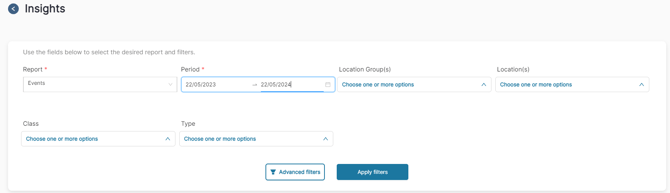
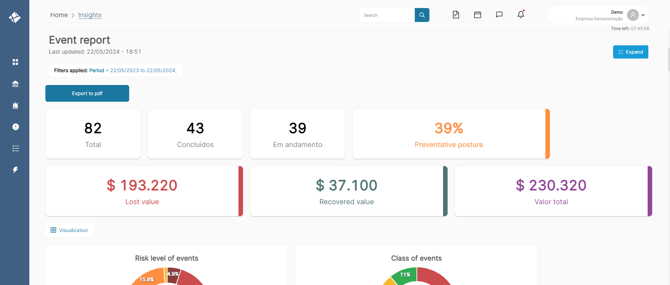
When generating a report, you will have a comprehensive view of the topic, separated by cards and graphs to simplify analysis and presentations.
How to edit the form view
-3.png?width=654&height=280&name=SC%20-%20Atividades%20-%20Tarefas%20(6)-3.png)
3. Click on Visualization.
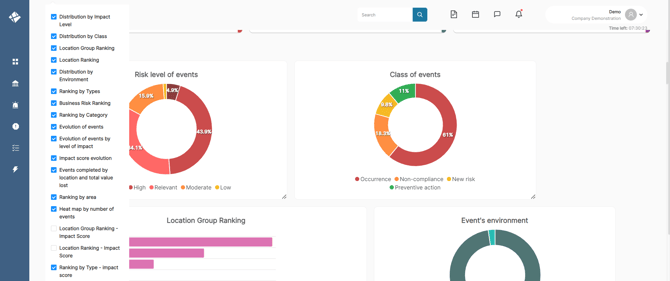
4. Select which graphs you want to see in your report.
-2.png?width=654&height=278&name=SC%20-%20Atividades%20-%20Tarefas%20(7)-2.png)
5. Select the three-line icon in the bottom corner of the graph and adjust it to the desired size.
-3.png?width=654&height=278&name=SC%20-%20Atividades%20-%20Tarefas%20(8)-3.png)
6. To expand your report, click on the expand icon in the right corner of the screen.
How to export the report
-2.png?width=654&height=278&name=SC%20-%20Atividades%20-%20Tarefas%20(9)-2.png)
7. Configure your desired view and click on Export to PDF.